
I. Introduction
The Strait of Hormuz is the single most important maritime chokepoint for the world’s hydrocarbons, and it is the shared outlet for most exports of the six economies of the Gulf Cooperation Council (GCC). Its disruption since 28 February 2026 therefore lets us see how one external constraint hits, to very different degrees, a group of neighbouring resource exporters that share a currency-peg framework but differ sharply in geography, pipeline access, and fiscal space.
This report addresses three questions. First, how large has the disruption been, and how has it evolved over seven months. Second, how unevenly has it affected the six member economies, through both oil and non-oil export channels, and how does that damage transmit to growth and public budgets. Third, what coordinated policy response follows from the pattern of exposure. The assessment is descriptive and is based on official releases and market sources available through 6 October 2026; it does not estimate a formal model, which is left to future work.
The report proceeds as follows. Section 2 documents the scale of the disruption. Section 3 examines the export channels, oil and non-oil, and summarises country exposure in an exposure matrix. Section 4 traces the transmission to growth, public budgets, and the wider economy. Section 5 sets out the policy implications, and Section 6 concludes.
II. The scale of the disruption
In 2024 about 20 mb/d transited the Strait, close to 20% of global petroleum liquids consumption and more than one-quarter of all seaborne oil trade. Crude output across the seven OPEC+ members bordering the Strait fell to 14.6 million barrels per day (mb/d) in April, about 40% below February levels. Iraq and Kuwait began shutting in production in early March as storage filled up. A brief arrangement between the United States and Iran reopened the Strait toll-free from mid-June, but it broke down in early July after attacks on commercial vessels. Negotiations over a supervised middle corridor through Omani and Iranian waters, and over Iran’s reported demand for transit fees of 5 to 7% of cargo value, have not yet produced a durable regime.
The graphs below shows the collapse in both oil volumes and vessel crossings. In the week to 20 September, confirmed oil transits averaged about 7.0 mb/d, roughly 38% of the 18.3 mb/d pre-crisis baseline, while daily vessel crossings fell to single digits against a norm of about 85. The gap between the two ratios reflects the concentration of remaining flows in large crude carriers.
Choked Out
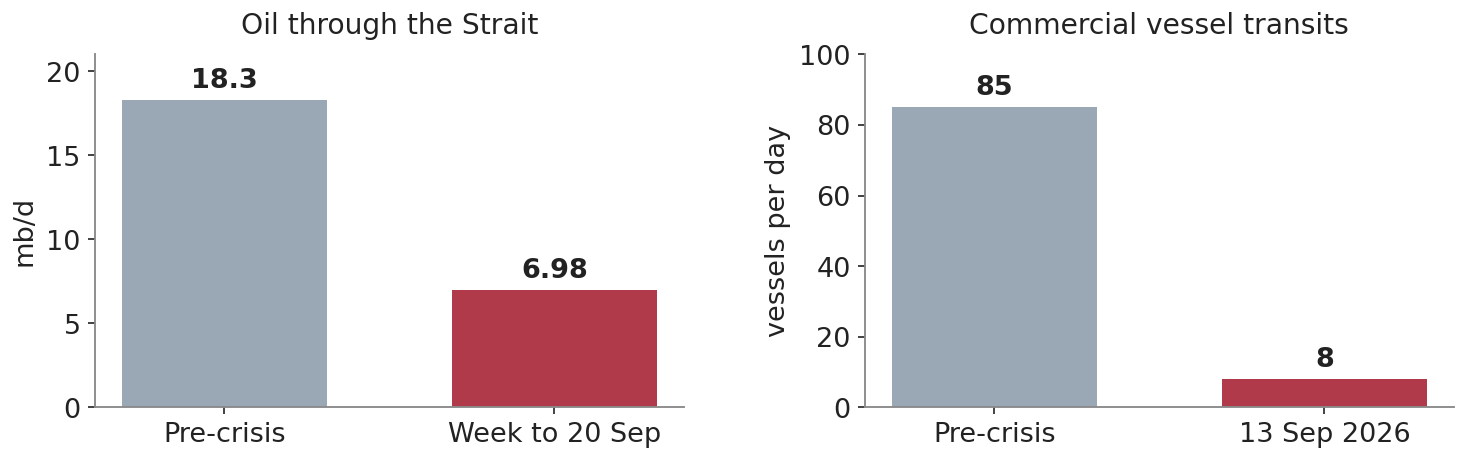
Traffic through Hormuz, seven months into the crisis. Oil volumes through the Strait (left) and commercial vessel transits per day (right), pre-crisis baseline against the latest reading. Source: Kpler via CNBC (23 Sep 2026); International Monetary Fund PortWatch via Straits Daily Brief (17 Sep 2026).
III. Impact on exports
Crude oil: a price gain offset by volume losses
For Gulf producers the usual oil shock, in which higher prices bring windfall revenue, has not held. Brent rose past US$120 early in the conflict and was still around US$104 in mid-September. Revenue is price times volume, however, and volume has fallen wherever there is no bypass route. Saudi Arabia’s East-West pipeline to Yanbu, recently expanded from 5 to about 7 mb/d, carries part of the flow, of which around 2 mb/d feeds domestic refineries, leaving roughly 5 mb/d for export, a substantial reduction from normal export volumes. The Habshan-Fujairah line, with a capacity near 1.5 to 1.8 mb/d, allowed the United Arab Emirates to recover its exports to about 85% of pre-crisis levels by June according to the International Energy Agency, although strikes on Fujairah show that the bypass itself can be targeted. Kuwait, Qatar, and Bahrain have no maritime alternative.
Liquefied natural gas and helium: the exposure of Qatar
Qatar has experienced the most severe shock in the bloc. Qatar supplied 18.8% of global LNG in 2024, the third-largest share worldwide, almost all of it shipped through the Strait. QatarEnergy declared force majeure in early March, and Iranian strikes on Ras Laffan on 18 to 19 March damaged liquefaction trains and the Pearl gas-to-liquids (GTL) complex. QatarEnergy’s chief executive has put annual losses at close to US$20 billion and estimated three to five years for full repairs, the binding constraint being the long lead time for specialised refrigeration-compressor turbines. Helium, a by-product of liquefied natural gas (LNG) processing, extends the damage worldwide: Qatar supplied about 63 million cubic metres in 2025, roughly one-third of world output according to the U.S. Geological Survey, and a critical input for semiconductor fabrication in Korea and Taiwan. By late August the Helium-2 plant was running at about 25% of capacity. Each month of disruption encourages buyers to diversify towards United States, Russian, and Algerian supply, so Qatar faces a risk to long-term market share, not only to current revenue.
Fertilisers and sulphur
The Gulf, together with Iran, accounts for about 36% of global urea exports, close to one-third of world volume, with Iran, Qatar, and Saudi Arabia the largest exporters. The closure blocked roughly 21 million tonnes a year of regional urea export capacity (including that of Iran) and about 4 million tonnes of diammonium phosphate (DAP) capacity. Urea prices more than doubled, from about US$400 per tonne to over US$850 per tonne in April, before easing to US$453 per tonne in June according to the World Trade Organization.
The graph below summarises the price moves across the non-oil export base. Mirror-trade data show first-half 2026 nitrogen exports down 63% for Saudi Arabia, 37% for Qatar, and 29% for the United Arab Emirates. Sulphur, where the Gulf has held close to half of world trade over the past decade, has also fallen sharply. For GCC producers the price spike offered no windfall, because plants ran at reduced rates to avoid filling their storage.
The Squeeze Downstream
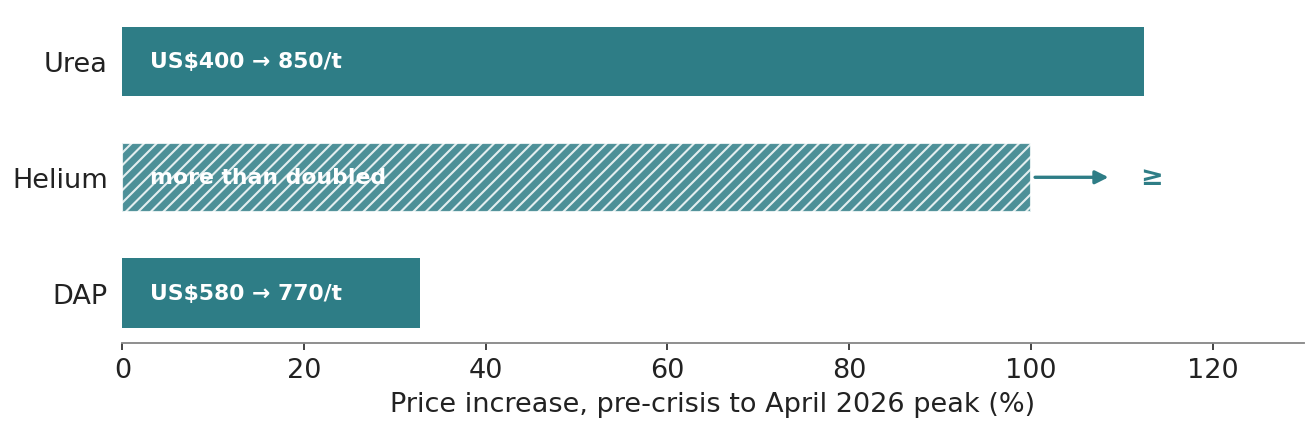
Price increase in the Gulf’s non-oil exports, from the pre-crisis level to the April 2026 peak, on a common basis. Urea rose about 113% (from US$400 to US$850 per tonne) and DAP about 33% (from US$580 to US$770). Helium more than doubled; its bar is shown as a lower bound because only a qualitative estimate is available. Aluminium is not plotted on this axis: its reported move was about 6% in a single London Metal Exchange (LME) session on 28 to 30 March, a different horizon. Source: World Trade Organization Data Blog (Jul 2026); World Bank Commodity Markets; industry reports on helium (2026).
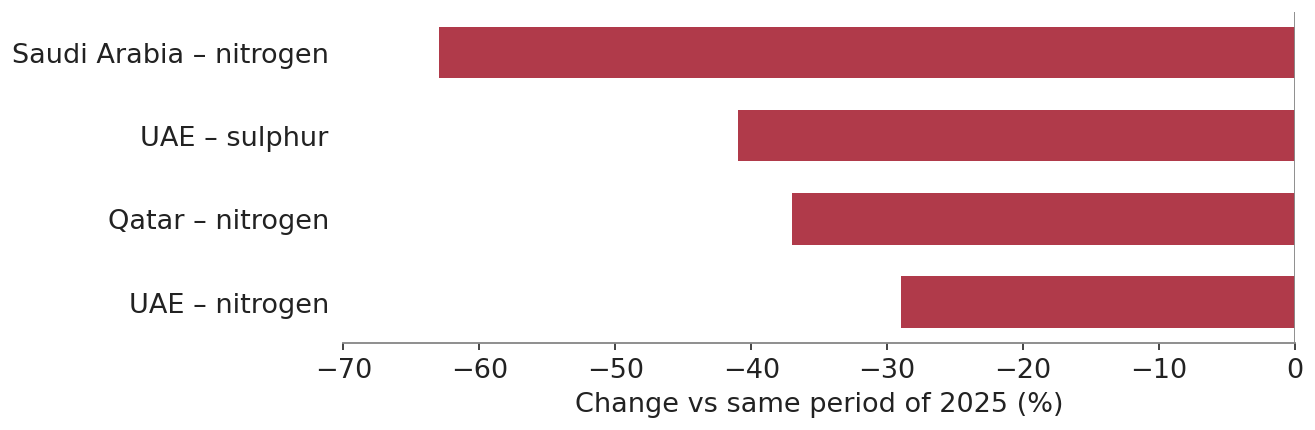
Gulf fertiliser and sulphur exports, first half of 2026, change against the same period of 2025. Nitrogen figures are in nitrogen-equivalent terms. Source: IFPRI mirror-trade analysis (Sep 2026) .
Aluminium
The GCC produces about 8 to 9% of the world’s primary aluminium, roughly one-quarter of output outside China, and exports more than 80% of it. The sector was affected through four channels: exports were blocked; alumina imports were cut off (the region has only two alumina refineries serving six smelters); on 28 March missiles struck the Al Taweelah smelter of Emirates Global Aluminium (EGA) in Abu Dhabi, and Aluminium Bahrain’s (Alba) plant in Bahrain; and gas shortages forced Qatalum to shut down on 3 March. By September EGA’s Al Taweelah was operating at about 18% of capacity, Alba’s second-quarter sales were down 32% year on year, and regional output as a whole had fallen to about 38% of pre-war levels. Analysts expect the region to lose 3 to 3.5 million tonnes of output in 2026, about 5% of global supply. The exception is Ma’aden, which, with its own bauxite, refinery, and smelter, kept operating and supplied alumina to Alba overland. This experience supports vertical integration as an industrial policy.
Variance in Crisis Exposure
| Country | Oil bypass (capacity | Key non-oil exports affected | 2026 GDP (IMF April Forecast) | Fiscal Vulnerability |
| Saudi Arabia | Partial (East-West ~5-7 mb/d) | Urea, DAP, petrochemical (Jubail) | +3.1% | Deficit well above budget; high capital spending |
| UAE | Partial (Habshan-Fujairah ~1.5-1.8 mb/d) | Aluminium, re-exports, aviation | +3.1% | Low; large sovereign-fund buffers |
| Oman | Terminals outside the Strait | Limited direct exposure | +3.5% | Moderate; debt near 36% GDP |
| Qatar | None | LNG, helium, urea, alumnium | -8.6% | Revenue collapse; large QIA buffer |
| Kuwait | None | Refined products, petrochemical | -0.6% | Budget almost entirely oil-funded |
| Bahrain | None | Aluminium, refined products | -0.5% | Severe public debt near 150% GDP |
Sources: World Bank country Macro Poverty Outlooks, October 2026, and October regional update; bypass capacity from pipeline operator and press reports; oil-flow baseline from the U.S. Energy Information Administration.
IV. Macroeconomic and fiscal transmission
Growth
The World Bank’s October update shows a sharp reversal from 2025: MENAAP growth slows from 3.3% to a projected contraction of 2.1%, while GCC growth moves from 4.5% to a projected contraction of 4.3%. Across GCC members, Qatar (-20.9%) and Kuwait (-14.6%) face the deepest contractions, while Oman is projected to grow by 3.1%. Saudi Arabia and the United Arab Emirates are projected to contract by 2.0% and 1.6%, respectively, and Bahrain by 2.9%. These forecasts differ from the earlier IMF projections. For 2027 the World Bank projects a GCC-wide rebound of 8.6% , with growth of 26.7% in Qatar, 22.0% in Kuwait, 9.5% in the United Arab Emirates, 7.9% in Saudi Arabia, 4.2% in Bahrain, and 3.4% in Oman, conditional on a gradual de-escalation and normalization of export routes. The large projected rebounds for Qatar and Kuwait partly reflect base effects after their deep 2026 contractions; they remain forecasts, not observed outcomes. The second-quarter outturns confirm the pattern: Saudi real GDP contracted 4.8% year on year in the second quarter, with oil activity down 24.7% and subtracting 5.4 percentage points from growth, so the non-oil economy was still expanding. The shock is a volume shock concentrated in hydrocarbons, but it is spreading.
Uneven Hits to GDP
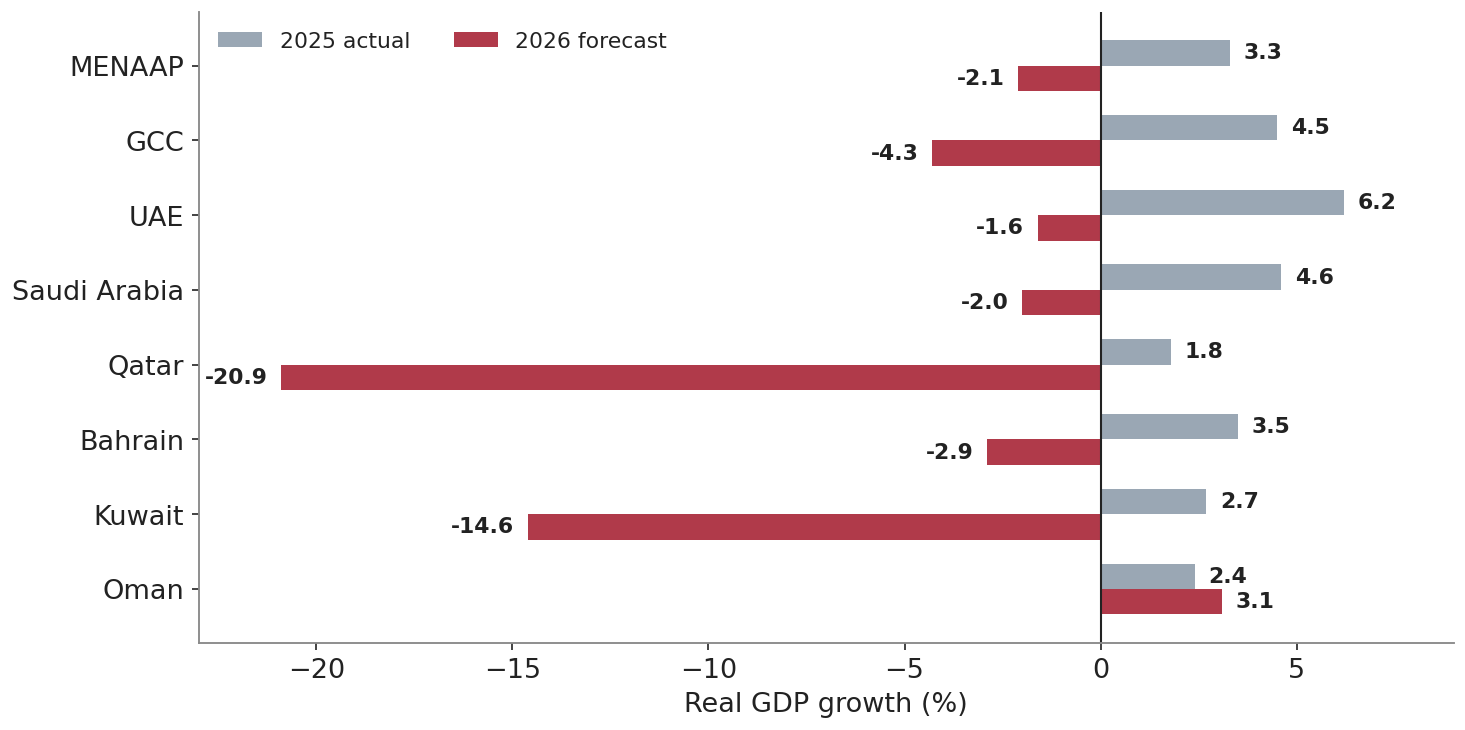
World Bank actual real GDP growth in 2025 and forecasts for 2026. Regional aggregates and GCC member countries are shown. Source: World Bank, October 2026 regional update and country Macro Poverty Outlooks.
Public budgets and deficits
Saudi Arabia shows the fiscal mechanics most clearly. The first-quarter deficit reached SR125.7 billion, about three-quarters of the SR165 billion annual deficit projected in the original budget. It narrowed to SR34.3 billion in the second quarter as Red Sea exports and higher prices restored oil revenue, bringing the first-half total to SR160 billion. Market estimates put the full-year deficit at 6 to 6.6% of GDP. The International Monetary Fund aggregate GCC fiscal balance of -1.4% of GDP conceals wide differences: Bahrain, where oil and aluminium together provide over two-thirds of government revenue and public debt is around 150% of GDP, has very little room to absorb the shock. Kuwait and Qatar hold ample sovereign assets but have lost most of their current revenue. Abu Dhabi, Qatar, and Kuwait raised close to US$10 billion through private bond placements in April, a sign that even the richest states prefer borrowing to selling assets at depressed prices.
Saudi Arabia’s Fiscal Shock
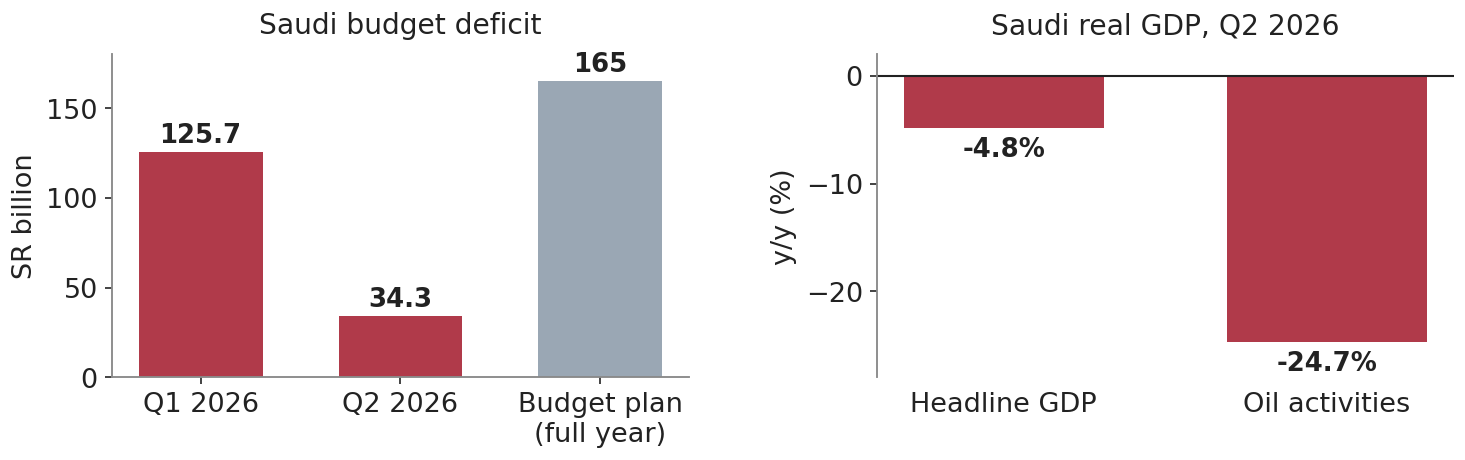
Fiscal and output shock in the largest GCC economy. Saudi budget deficit by quarter against the full-year budget plan (left) and Saudi real GDP growth in the second quarter of 2026, year on year (right). Source: Saudi Ministry of Finance via Al Jazeera and Arab News; GASTAT flash estimate via Enterprise.
The private sector and the wider economy
The non-oil private sector has been affected through four channels. (i) Through trade and logistics, container traffic has been rerouted, war-risk insurance premiums have risen sharply, and Jebel Ali congested in the spring as cargo was diverted. (ii) Through imported inflation, GCC states import most of their food and many intermediate goods, and every alternative route adds cost and time. (iii) Through aviation and tourism, Kuwait and Manama airports saw complete suspensions early in the conflict, and the hub model of Dubai and Doha depends on perceptions of safety. And (iv) through confidence and credit, project announcements are being deferred, and slower government payments flow directly through to contractors and small and medium-sized enterprises.
Dubai’s Dh1 billion stimulus and central-bank liquidity and loan-deferral measures have eased the pressure but do not address the underlying constraint. The purchasing managers’ indices for Saudi Arabia and the United Arab Emirates show resilience, which reflects their bypass routes; Kuwait, Qatar, and Bahrain lack that cushion .
Two longer-term risks deserve attention. The first is hysteresis in market share, as Asian buyers of liquefied natural gas, helium, urea, and aluminium sign long-term contracts with other suppliers. The second is a procyclical fiscal reflex: if governments cut capital spending and wages to close deficits, the external shock will become a domestic recession, the pattern that Gulf economies repeated after 1986, 2015, and 2020.
V. Policy implications
Each GCC state is only as protected as its weakest shared chokepoint, and no state can escape that constraint by acting alone. The recommendations below are therefore regional.
Industrial policy: from export enclaves to integrated value chains
- Vertical integration of strategic inputs. Build a jointly owned GCC alumina refinery on the Red Sea or Arabian Sea coast, using Ma’aden’s bauxite, so that smelters do not depend on seaborne alumina through Hormuz. Apply the same logic to catalysts, spare turbines, and other critical components through pooled regional inventories.
- Relocate new capacity outside the Strait. Direct new petrochemical, fertiliser, and metals investment towards Yanbu, Jizan, Duqm, Sohar, and Fujairah, and link it to Gulf feedstock by pipeline.
- Develop regional downstream demand. Use Gulf aluminium, polymers, and fertilisers as inputs to GCC construction, packaging, automotive, and agriculture, with local-content rules tied to performance and export targets rather than open-ended protection.
- Strategic helium and industrial-gas storage. Qatar should build buffer storage and diversified cryogenic logistics, including an overland route to Omani ports, to protect its position as a reliable supplier.
Sovereign wealth funds as counter-cyclical stabilisers
GCC sovereign wealth funds (SWFs) hold several trillion dollars in assets, and this crisis is precisely the contingency such funds are designed to address. A demand-focused reading suggests that the binding constraint is not financing but a shortfall in effective demand, so the aim should be to maintain spending rather than cut it.
- Domestic stabilisation windows. Create ring-fenced sleeves, for example 3 to 5% of assets, to fund public investment that sustains demand, with transparent rules for activating and ending them.
- Maintain capital spending. Keep priority infrastructure (rail, ports, pipelines, power interconnection) rather than cutting it, because these projects support demand now and reduce future exposure.
- Support private-sector liquidity. Provide credit guarantees to small and medium-sized enterprises, clear government arrears quickly, and offer temporary payroll support for nationals and residents in affected sectors such as logistics, hospitality, and aviation.
- Regional solidarity. Establish a GCC stabilisation facility, financed by the wealthiest funds, to support Bahrain and other states with limited fiscal space through concessional loans or equity in resilience projects. This would help avoid a disorderly debt dynamic within the region’s fixed and basket-based exchange-rate arrangements .
Economic integration
- Complete the customs union and common market. Remove remaining non-tariff barriers, harmonise standards, and adopt single-window customs so that overland trade diverted from the sea can move without friction.
- A GCC energy-security compact. Link Kuwaiti, Qatari, and Bahraini crude and product flows into the Saudi East-West system and expand its capacity. Extend the route to Fujairah in the United Arab Emirates and study a gas link to the Omani coast. Build joint strategic reserves of crude, refined products, food, and medicines.
- Regional insurance and finance. Create a GCC war-risk and trade-credit reinsurance pool so that insurance cover can continue when international markets withdraw.
Logistics policy
- Treat the GCC Railway as critical infrastructure. It is now about half complete. Fast-track it with dedicated SWF financing and prioritise the freight links to Red Sea and Arabian Sea ports.
- A network of ports outside the Strait. Coordinate Jeddah, Yanbu, NEOM, Duqm, Sohar, Salalah, Fujairah, and Khor Fakkan as one system, linked by dry ports, bonded corridors, and harmonised trucking permits, building on the Oman-UAE corridor that has carried food and medicine this year.
- Digital corridors. Share cargo-tracking data, common electronic documentation, and pre-clearance so that goods are not held at land borders.
Cooperation rather than competition
Before the conflict, GCC states competed to build overlapping airports, ports, smelters, petrochemical complexes, and free zones, often financed by rival sovereign funds. The crisis shows the cost of that duplication: capacity is concentrated behind the same chokepoint while alternative routes are underbuilt. A GCC Investment Coordination Council, with a regional project register, joint feasibility reviews for large projects, and a presumption in favour of joint ventures such as the Alba-Ma’aden relationship, would reduce projects that otherwise duplicate each other. Specialisation should follow comparative advantage and geography: the Saudi and Omani coasts for export logistics, Qatar for gas-based chemicals and industrial gases, the United Arab Emirates for finance, aviation, and trade services, and Bahrain for downstream metals and financial services.
Other measures
- Food and input security. Build regional grain and fertiliser reserves, invest in controlled-environment agriculture, and use Gulf urea for regional food production.
- Fiscal rules and revenue diversification. Adopt medium-term expenditure frameworks with structural, rather than price-based, balance targets, and broaden non-oil revenue gradually once recovery is secure rather than during the downturn.
- Diplomacy and maritime security. The GCC should negotiate collectively over any future Hormuz transit regime and oppose tolls, because acting separately weakens its bargaining power.
- Data and early warning. Set up a regional dashboard of high-frequency trade, shipping, and price data to inform coordinated responses.
VI. Conclusion
The Hormuz closure shows that the GCC is not a single shock-absorbing bloc but six economies with very different exposure: Saudi Arabia, the United Arab Emirates, and Oman hold bypass routes, while Qatar, Kuwait, and Bahrain are largely dependent on the Strait. The World Bank projects a strong 2027 rebound, conditional on conflict de-escalation and the normalization of export routes. That recovery does not remove the risks from lost market share, damaged capital stock, or procyclical fiscal responses. The costliest course would be to wait for the Strait to reopen and return to the previous model. The better course is to use sovereign wealth to sustain demand now and to invest it jointly in integrated value chains, coordinated logistics, and regional risk-sharing that reduce the region’s dependence on a single strait.
This publication has been supported by the Rosa-Luxemburg-Stiftung. The positions expressed herein do not necessarily reflect the views of Rosa-Luxemburg-Stiftung.
Photo credit: “Strait of Hormuz” by Fragile Oasis, CC BY-NC-SA 2.0
Sources Consulted
International Monetary Fund, World Economic Outlook, April 2026 and July 2026 Update; Regional Economic Outlook: Middle East and Central Asia, April 2026.
World Bank, From Divide to Opportunity: AI, Jobs, and Growth, MENAAP Economic Update, October 2026.
World Bank, country Macro Poverty Outlooks, October 2026: Bahrain, Kuwait, Oman, Qatar, Saudi Arabia, and United Arab Emirates.
“World Bank Says Middle East Economy to Contract 2.1% in 2026 on Iran War,” The National, 6 October 2026.
U.S. Energy Information Administration, Today in Energy: oil flows through the Strait of Hormuz, 2024 to 2026.
International Gas Union, World LNG Report 2025 (Qatar 18.8% of global LNG exports in 2024).
U.S. Geological Survey, Mineral Commodity Summaries 2025: Helium.
Saudi Aramco East-West (Petroline) capacity via Argaam and S&P Global (Mar 2026); Habshan-Fujairah capacity via CNBC (12 Mar 2026); International Energy Agency, Oil Market Report.
General Authority for Statistics (GASTAT), flash GDP estimate, second quarter 2026, via Enterprise (2 Aug 2026).
Kpler data via CNBC (23 Sep 2026); International Monetary Fund PortWatch via Straits Daily Brief (17 Sep 2026); Carra Globe (30 Jul 2026).
PwC, Middle East Economy Watch (May 2026); Federal Reserve Bank of Dallas (Mar 2026); Nasser Saidi & Associates, weekly insights (Apr and Aug 2026).
Saudi Ministry of Finance budget reports via Al Jazeera (6 May 2026) and Arab News (30 Jul 2026); General Authority for Statistics (GASTAT) flash GDP via Enterprise (2 Aug 2026).
Tim Callen, “Saudi Fiscal Deficit To Be Larger Than Budgeted in 2026,” Arab Gulf States Institute, 1 October 2026.
World Trade Organization Data Blog (10 Jul 2026); World Bank Commodity Markets blog (May 2026); International Food Policy Research Institute (May and Sep 2026); Agricultural Market Information System.
Chemical & Engineering News (Mar 2026); Fusion Worldwide helium outlook (Aug 2026); WestAir (Jun 2026).
AGBI (Sep 2026); AL Circle (Jul 2026); Exiger (Apr 2026); The National (Mar, Apr, and Jul 2026).
Middle East Council on Global Affairs, “Gulf Sovereign Wealth Funds and the Cost of Crisis Resilience” (May 2026).
Abbreviations
DAP
Diammonium phosphate
EGA
Emirates Global Aluminium
GASTAT
General Authority for Statistics (Saudi Arabia)
GCC
Gulf Cooperation Council
GTL
Gas-to-liquids
IEA
International Energy Agency
IMF
International Monetary Fund
LME
London Metal Exchange
LNG
Liquefied natural gas
mb/d
Million barrels per day
PMI
Purchasing managers’ index
QIA
Qatar Investment Authority
SWF
Sovereign wealth fund
WTO
World Trade Organization
[1] Corresponding author: jqanas@qu.edu.qa.